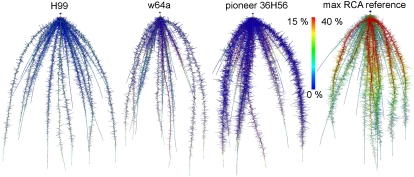
Figure 3.
Spatial map of RCA formation in simulated root systems at 40 d after germination. Colors show RCA formation as percentage of root cross-sectional area. The color range differed for the max RCA reference root system, which was rendered on a 0% to 40% scale instead of a 0% to 15% scale. See text for detailed description of the differences among these genotypes, which include variation in the steepness and number of major axes, lateral branching density, lateral root length, and RCA formation. Roots have been dilated (approximately two times) for better visibility and thus do not show true root thickness.

