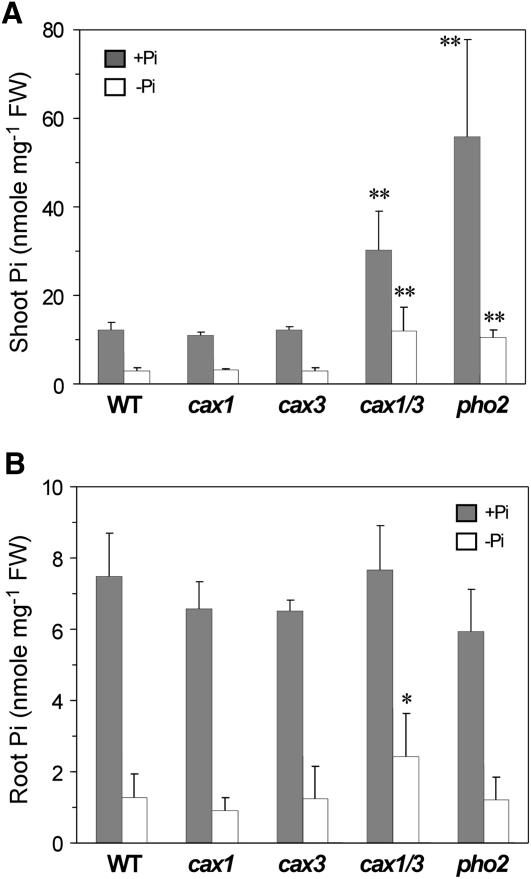
Figure 1.
Analysis of Pi concentrations in the cax1/cax3 mutant. The Pi concentrations are shown in the shoot (A) and root (B) of 23-d-old wild-type (WT), cax1, cax3, cax1/cax3, and pho2 plants grown under +Pi or −Pi conditions. Values represent means + sd of three to five biological replicates. Data significantly different from the corresponding wild-type controls are indicated (* P < 0.05, ** P < 0.01; Student’s t test). FW, Fresh weight.

