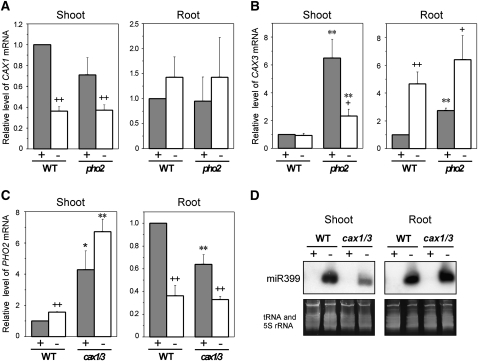
Figure 4.
Pi starvation regulation of CAX1, CAX3, PHO2, and miR399 expression in the cax1/cax3 and pho2 mutants. A and B, qRT-PCR analysis of CAX1 (A) and CAX3 (B) expression in the shoot and root of wild-type (WT) and pho2 plants. C and D, qRT-PCR analysis of PHO2 expression (C) and small RNA gel-blot analysis of mature miR399 (D) in the shoot and root of wild-type and cax1/cax3 plants. Plants were hydroponically grown under +Pi (+) or −Pi (−) conditions. The value for each gene is presented as the fold change relative to the expression in wild-type plants under +Pi conditions. tRNA and 5S rRNA were used as loading controls for small RNA. Error bars represent se of biological replicates from three independent experiments. Data significantly different from the corresponding controls are indicated (mutant versus the wild type, * P < 0.05, ** P < 0.01; Pi sufficient versus Pi deficient, + P < 0.05, ++ P < 0.01; Student’s t test).

