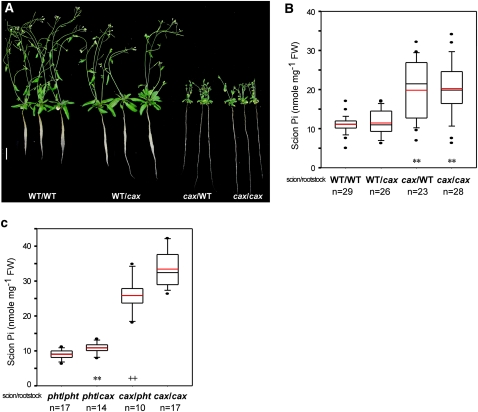
Figure 8.
Analysis of reciprocal grafting of wild-type (WT), pht1;1, and cax1/cax3 plants. Shown are the phenotypes (A; bar = 1 cm) and the scion Pi concentrations of 6-week-old grafted plants between wild-type and cax1/cax3 plants (B) and between pht1;1 and cax1/cax3 plants (C). The Pi concentrations are presented as box plots. The boundaries of the boxes indicate the 25th and 75th percentiles. The median and the mean are marked by black and red lines, respectively, within the box. Error bars above and below the box indicate the 90th and 10th percentiles. Each individual plant outside the 10th and 90th percentiles is displayed as a single dot. In B, mean values significantly different from the wild-type self-grafts are indicated by asterisks (** P < 0.01; Student’s t test). In C, mean values showing significant differences between the pht1;1 self-grafts and the grafts with the pht1;1 scion and the cax1/cax3 rootstock (** P < 0.01; Student’s t test) and between the cax1/cax3 self-grafts and the grafts with cax1/cax3 scion and pht1;1 rootstock (++ P < 0.01; Student’s t test) are indicated by asterisks and crosses, respectively. n, The total number of grafted plants.

