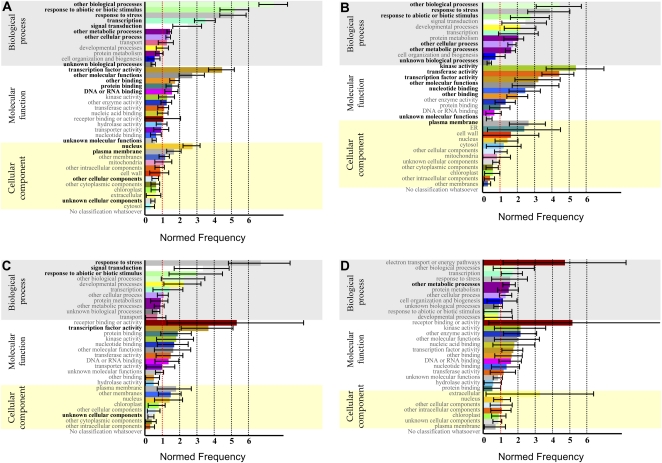
Figure 8.
Functional classification of differentially expressed transcripts in ACSC under HL stress. The 305 transcripts differentially expressed were classified based on the Classification SuperViewer bioinformatic tool at the Bio-Array Resource Web site (http://bar.utoronto.ca/ntools/cgi-bin/ntools_classification_superviewer.cgi). A, Coregulation of aba1, max4, flu, and flu/over-tAPX. B, Coregulation of flu and flu/over-tAPX. C, Coregulation of aba1 and max4. D, Light- versus dark-specific responses in ACSC under HL stress.

