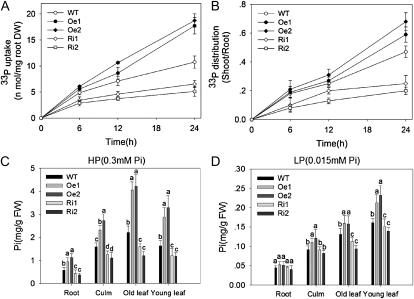
Figure 4.
Pi uptake in OsPT8-overexpressing and RNA interference lines. A, Pi uptake activity of wild-type (WT) and transgenic plants. DW, Dry weight. B, Shoot-root ratios of the 33P taken up by wild-type and transgenic plants. Error bars represent sd (n = 3). C and D, Pi contents in root, culm, old leaf, and young leaf were measured in 21-d-old seedlings of wild-type and transgenic plants grown in nutrient solution to which 0.3 mm Pi (HP) or 0.015 mm Pi (LP) was added. Five plants per line were measured. Error bars represent sd (n = 5). FW, Fresh weight.

