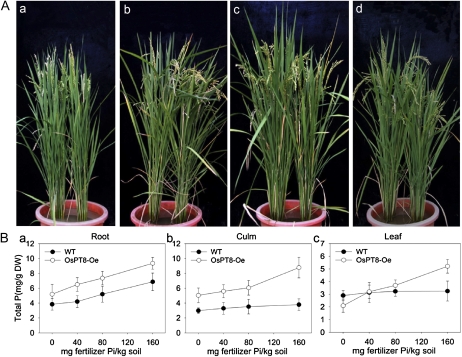
Figure 5.
Growth performances of the wild-type and OsPT8-overexpressing lines at different Pi levels in a pot experiment. A, Growth performance of wild-type and OsPT8-overexpressing plants at 0 mg fertilizer Pi kg−1 soil (a), 40 mg fertilizer Pi kg−1 soil (b), 80 mg fertilizer Pi kg−1 soil (c), and 160 mg fertilizer Pi kg−1 soil (d). Two seedlings were grown in each pot. The left one is the wild-type plant and the right one is the OsPT8-Oe plant. The photographs are representatives of five independent biological replicates. B, Total P concentration in root, culm, and leaf of wild-type (WT) and OsPT8-overexpressing plants at different Pi levels in the above pot experiment. Error bars represent sd (n = 5). DW, Dry weight.

