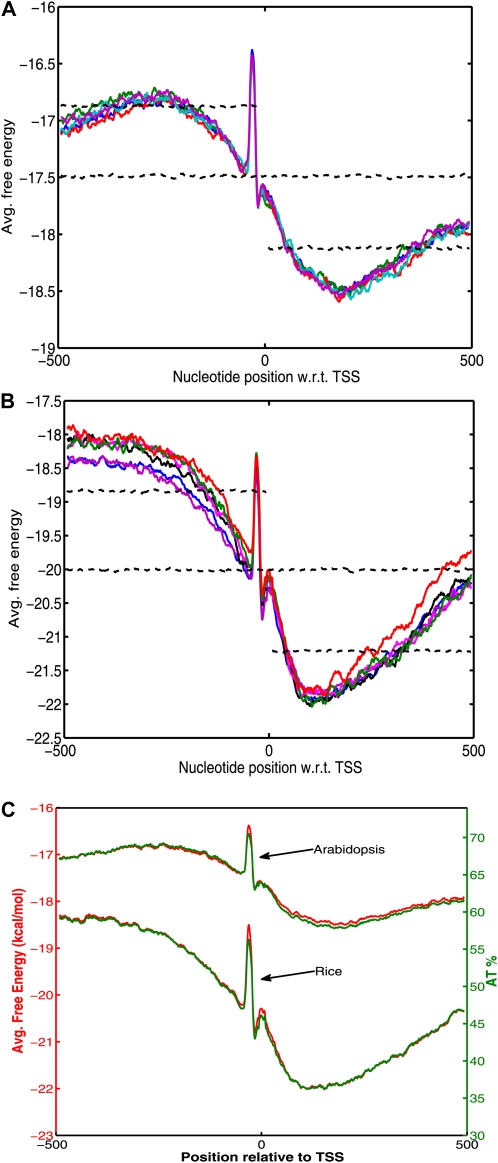
Figure 1.
A and B, AFE profiles in the vicinity of the TSS for all five chromosomes of Arabidopsis (A) and six representative (even numbered) chromosomes of rice (B). The AFE values for upstream, downstream, and full-length shuffled sequences are shown as dashed lines. C, Comparison of free energy profiles (shown in red) and percentage AT occurrence (shown in green) over the region −500 to +500 bp with respect to (w.r.t.) TSS for chromosome 1 of Arabidopsis and rice.

