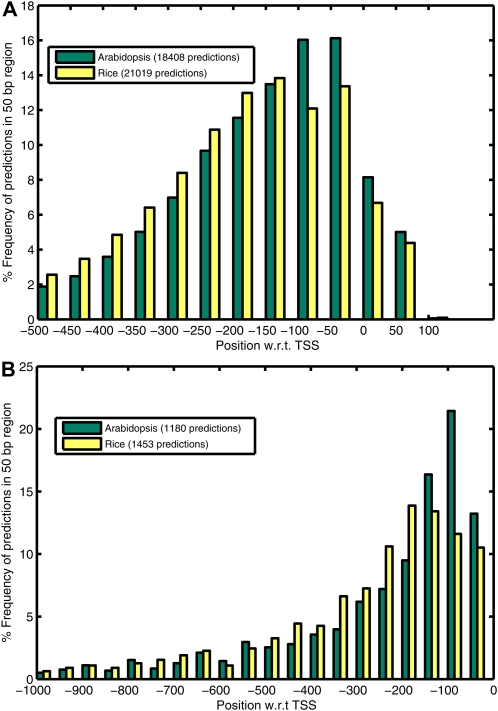
Figure 2.
Percentage frequency distribution plots showing the distance of promoter predictions from TSS in 50-nucleotide bins for protein-coding genes (A) and ncRNA genes (B). For protein-coding genes, the predictions within −500 to +100 bp with respect to (w.r.t.) TSS, and for ncRNA genes, predictions within −1,000 to 0 bp with respect to TSS, are considered where position 0 corresponds to the TSS. [See online article for color version of this figure.]

