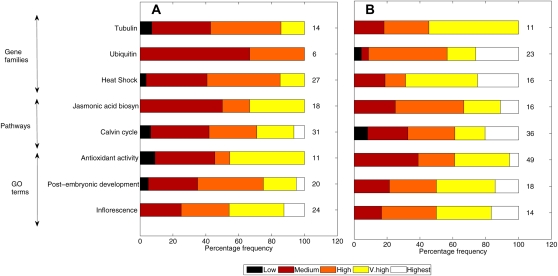
Figure 6.
Classification of gene families, metabolic pathway genes, and genes from specific GO terms for Arabidopsis (A) and rice (B) according to the TP with the highest prediction score present within −500 to +100 bp of the TSS. The distribution of the score categories is presented as a percentage of the TPgenes present in that category. The number adjacent to each bar indicates the number of TPgenes. [See online article for color version of this figure.]

