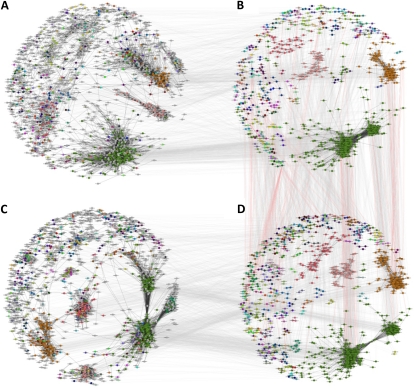
Figure 3.
Conserved subgraphs between rice and maize. A, The global locus-based network for rice. B, The conserved network for rice with colored subgraphs. C, The global locus-based network for maize. D, The conserved network for maize with colored subgraphs. Nodes in B and D are color coded according to the conserved subgraphs to which they belong. The same colored nodes in B belong to the same conserved subgraph in D. These same nodes are colored identically in the global networks to show global placement. Nodes colored gray in the global networks are not assigned to a conserved subgraph. Dark-colored edges in the global and conserved subgraphs represent coexpression edges. Lightly colored lines between the global networks in A and C and the conserved subgraphs in B and D simply indicate the positions of the same nodes in both types of networks. Lightly colored gray lines between the conserved subgraphs of rice and maize in B and D show the locations of aligned nodes as indicated by IsoRankN. Lightly colored red lines between B and D originate from the rice conserved subgraph in B and indicate known phenotypic associations in rice with possible translation to maize.

