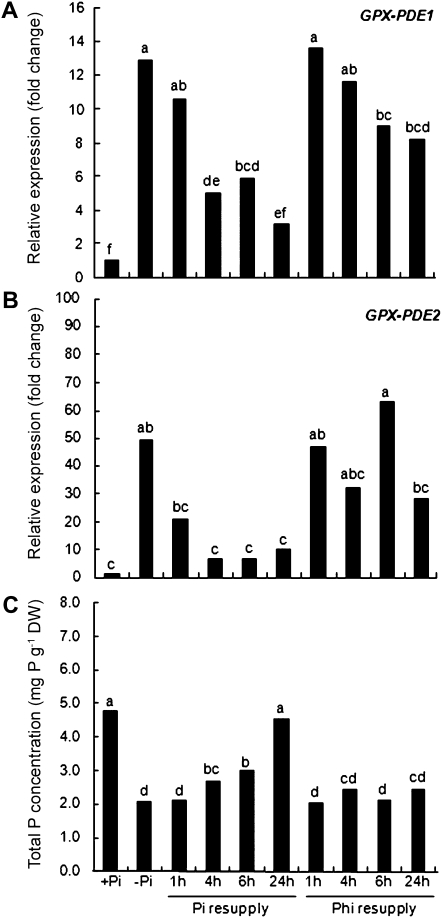
Figure 3.
The effect of Pi or Phi resupply on transcript abundance of Pi deficiency-induced GPX-PDE1 and GPX-PDE2. White lupin plants were grown to 14 d after emergence without Pi and then resupplied with 1 mm Pi. Control plants were grown for 14 d after emergence with +Pi (1 mm), −Pi (0 mm), or +Phi (1 mm). Cluster roots from control and treated Pi-resupplied plants excised at 1, 4, 6, and 24 h were used for RNA isolation and cDNA synthesis. A and B, GPX-PDE1 (A) and GPX-PDE2 (B) expression analyzed by qRT-PCR. C, Total P concentration in control and treated plants. Data are expressed as relative values based on the GPX-PDE1 or GPX-PDE2 expression level in +P normal roots and referenced as 1.0. Lowercase letters denote significant differences between treatments (P ≤ 0.05). Statistical significance was based on three biological replicates. DW, Dry weight.

