Figure 8.
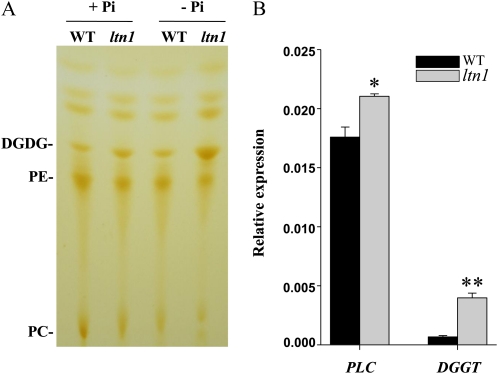
Lipid composition analysis in wild-type and ltn1 mutant plants. A, TLC analysis of lipid composition in roots of wild-type (WT) and ltn1 mutant plants under Pi-sufficient (+Pi; 16 mg L−1) or Pi-deficient (−Pi; 0 mg L−1) conditions. B, qRT-PCR expression analysis of genes encoding phospholipase C (PLC) and diacylglycerol galactosyltransferase (DGGT) in roots of wild-type (black bars) and ltn1 mutant (gray bars) plants under Pi-sufficient conditions (16 mg L−1). Error bars indicate sd (n = 3). Asterisks indicate the significance of differences between wild-type and ltn1 mutant plants as determined by Student’s t test analysis: * 0.01 ≤ P < 0.05, ** P < 0.01.

