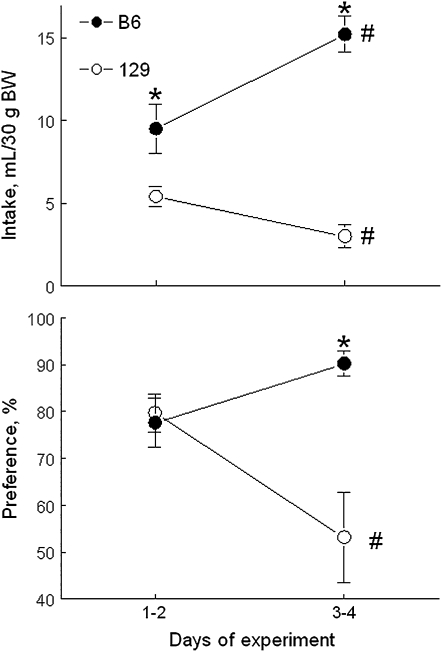
FIGURE 3.
Mean (±SEM) daily 300 mmol monosodium l-glutamate (MSG)/L intakes (upper panel) and preference scores (lower panel) of B6 mice and 129 mice during 96-h, 2-bottle preference tests. B6, C57BL/6ByJ mouse strain; 129, 129P3/J mouse strain; BW, body weight. *Significant difference between B6 mice and 129 mice (P < 0.05, planned comparisons). #Significant difference between days 1–2 and days 3–4 of the test (P < 0.05, planned comparisons). Modified with permission from reference 49.

