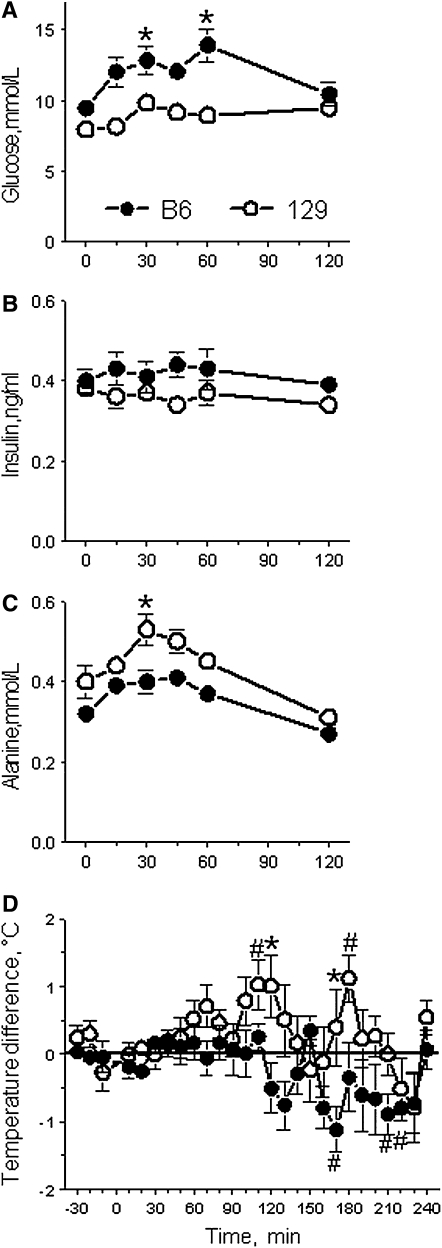
FIGURE 4.
Mean (±SEM) plasma concentrations of glucose (A), insulin (B), and alanine (C) and changes in body temperature (D) of B6 and 129 mice after intragastric administration of monosodium l-glutamate (MSG). Strain differences were significant for plasma glucose, insulin, and alanine [F(1,11) > 10.6, P < 0.05, ANOVA] and temperature changes [F(1,53) = 30.4, P < 0.0001]. B6, C57BL/6ByJ mouse strain; 129, 129P3/J mouse strain. *Significant difference between the 129 and B6 strains (P ≤ 0.05, post hoc tests; although insulin concentrations were significantly different between B6 mice and 129 mice in ANOVA, the strain differences did not reach the level of significance in the post hoc tests for any of the time points). #Temperature level significantly different from zero (P ≤ 0.05, one-sample t tests). At time 0, mice were administered with a single bolus of 591 mmol MSG/L (10% wt:vol) at the volume of 1 mL/100 g body wt and the dose 1 g/kg body wt. Blood was collected 6 times before and during the 2-h period after MSG administration. In separate groups of mice, body temperature was measured at 10-min intervals for 0.5 h before and for 4 h after MSG administration. In panel D values represent deviations in body temperature from those recorded after gavage with sodium chloride. Modified with permission from reference 67.

