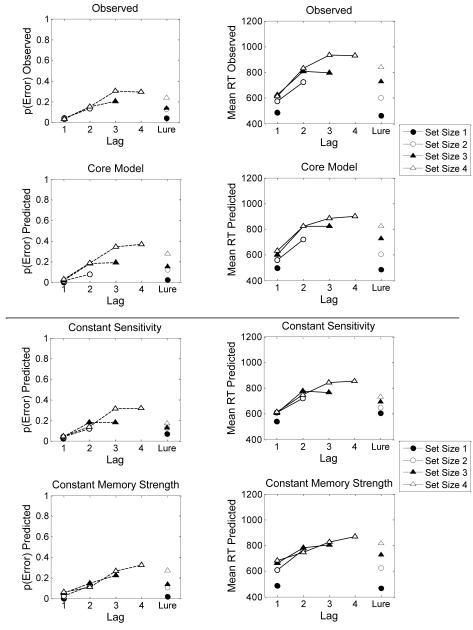
Figure 3.
Experiment 1, Observed summary trends and EBRW-predicted summary trends. Left panels: average error probabilities plotted as a function of lag, set size, and type of probe. Right panels: average mean RTs plotted as a function of lag, set size, and type of probe. Top row = observed, second row = core model, third row = constant-sensitivity special-case model, fourth row = constant memory-strength special-case model..

