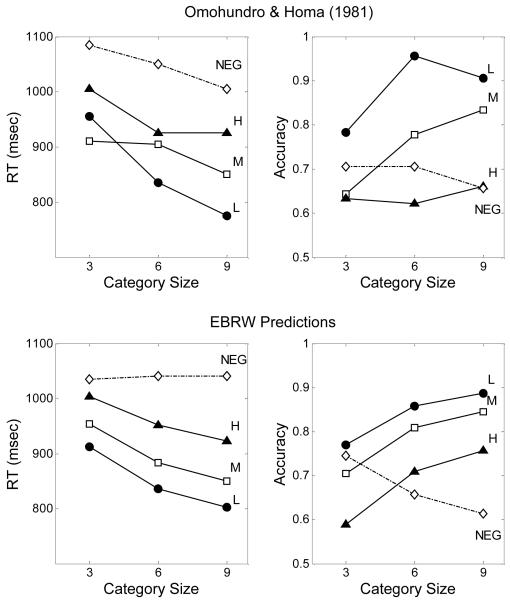
Figure 6.
Observed and EBRW-predicted data for Omohundro and Homa (1981, Experiment 2). Top panels: observed mean RTs and accuracies plotted as a function of category size and type of test probe. (Data are estimated from Omohundro and Homa’s Figure 4.) Bottom panels: EBRW-predicted mean RTs and accuracies. L = low distortion, M = medium distortion, H = high distortion, NEG = negative probe.

