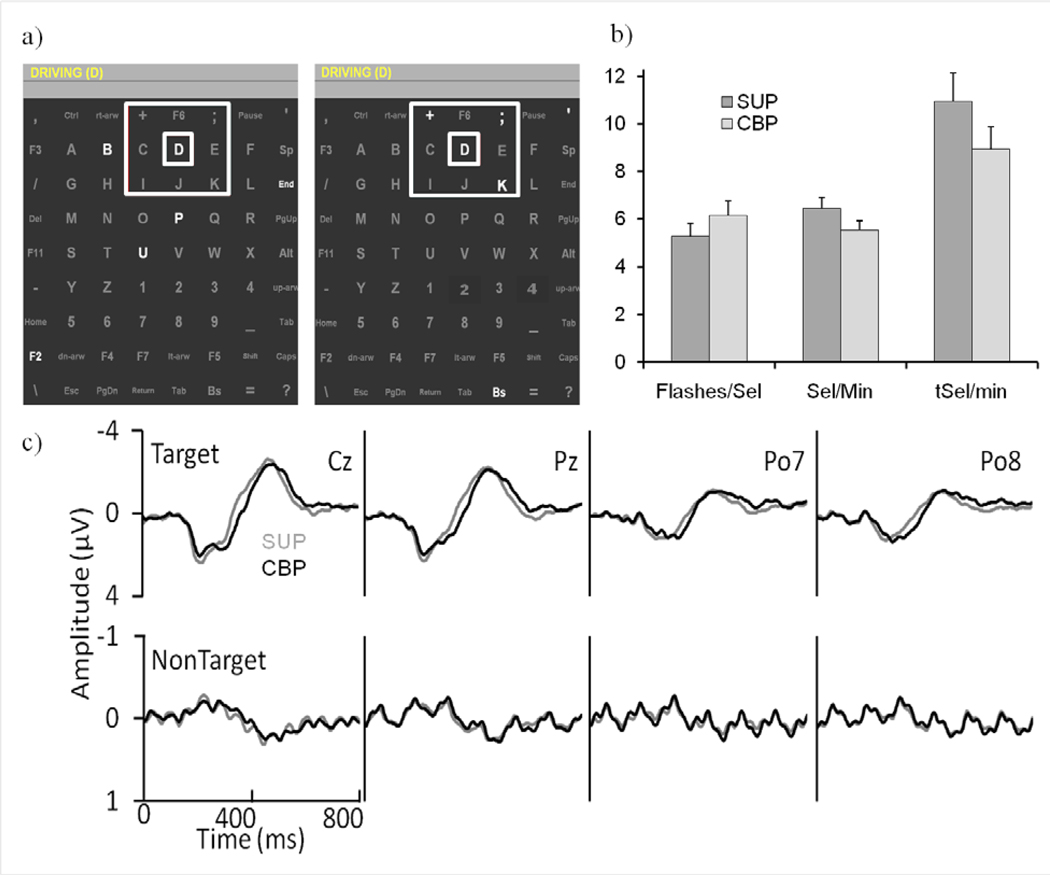
Figure 1.
Suppression condition presentation and data. (a) Left: Presentation of SUP (suppression condition) with flashes of all 8 adjacent diagonals restricted during a target flash. Right: A CBP (standard checkerboard) flash showing diagonal items flashing with the target. (b) Significant differences were found in flashes-per-selection, selections-per-minute and theoretical (t) selections-per-minute. (c) Grand mean waveforms for all 18 participants at electrode locations Cz, Pz, PO7, and PO8. The top row consists of target responses for both conditions, and the bottom row consists of non-target responses (SUP data is presented in grey and CBP data is presented in black).

