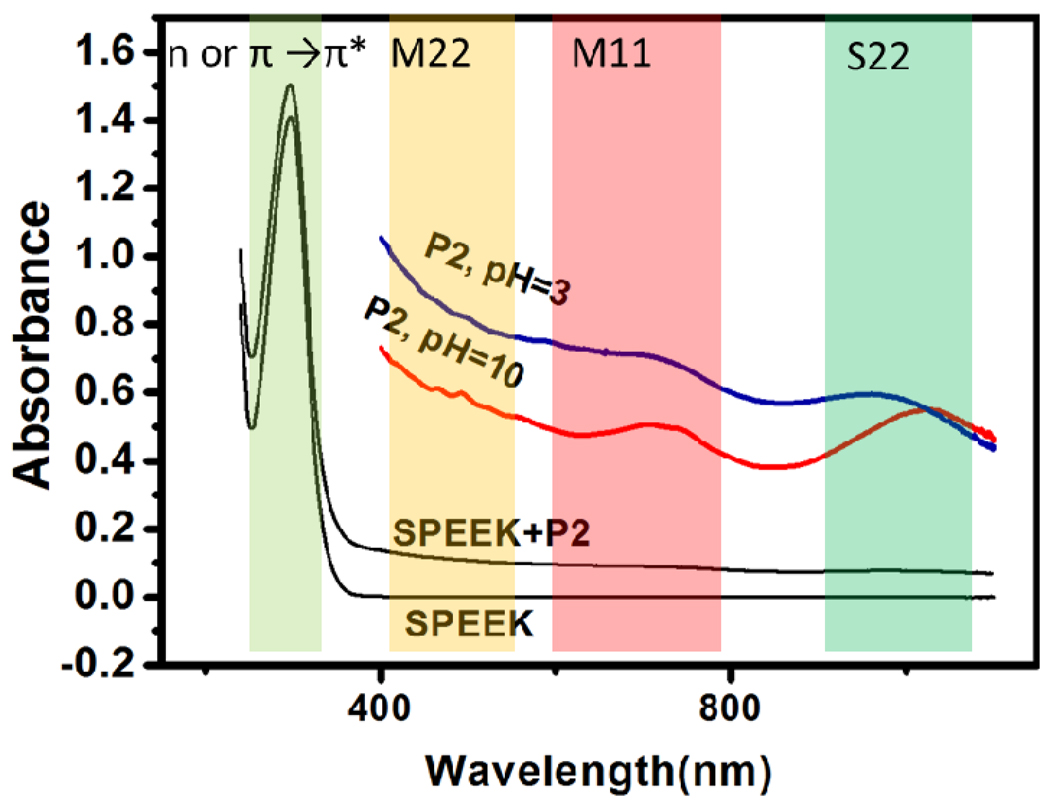
Figure 3.
UV-vis spectroscopy of SPEEK aqueous solution and SPEEK-stabilized P2 SWNT dispersions under pH=3 and pH=10. The spectra at range of 400nm and above were shown to highlight the difference between different pH. The vertical colored bands indicate the spectral regions of electronic transitions contributing to the UV spectra. From left to right, lighter green: π-π* and n-π* transition in phenyl rings or C=O bond in SPEEK; yellow: M11 transition in SWNT; Red: M22 transition in SWNT; green: S11 transition in SWNT.

