Figure 14.

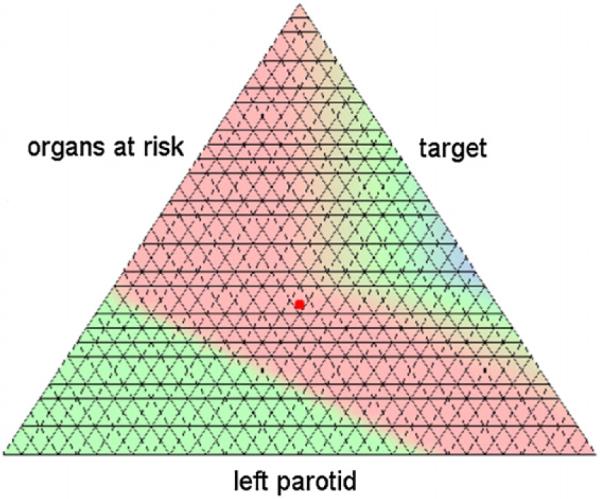
Map plot of the distance function for the head neck case II for parameters C = 50 and M = 32. The case specific beam setup is dominating in and around the solution depicted figure 13 (red point).

Map plot of the distance function for the head neck case II for parameters C = 50 and M = 32. The case specific beam setup is dominating in and around the solution depicted figure 13 (red point).