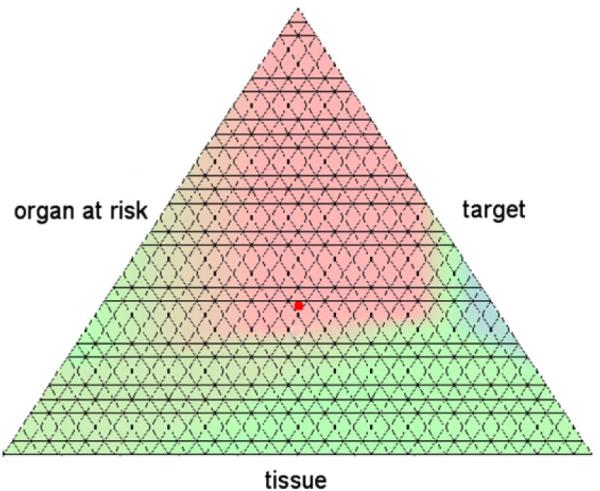
Figure 7.

The map plot of the distance function for the horse shoe target case. Areas where the heuristically obtained beam configuration is dominating are colored in red, and those where the equidistant setting dominates are colored in blue. The red dot denotes the solution for the heuristic beam setting for an equal weighting of all three criteria.
