Figure 8.

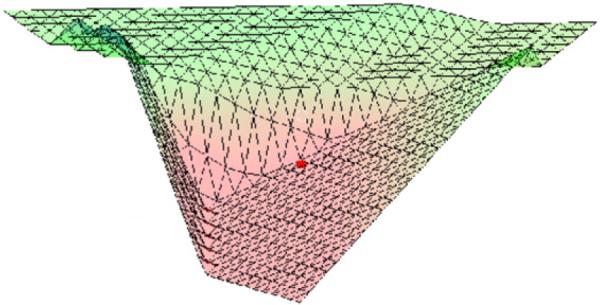
Surface plot of the distance function for the horse shoe target case. For a better visualization, the upper corner of the triangle in figure 7 is in front.

Surface plot of the distance function for the horse shoe target case. For a better visualization, the upper corner of the triangle in figure 7 is in front.