
Fig. 4. DiBAC staining reveals the Vmem pattern of blastomere membranes under normal conditions and in H+-V-ATPase inhibitor.
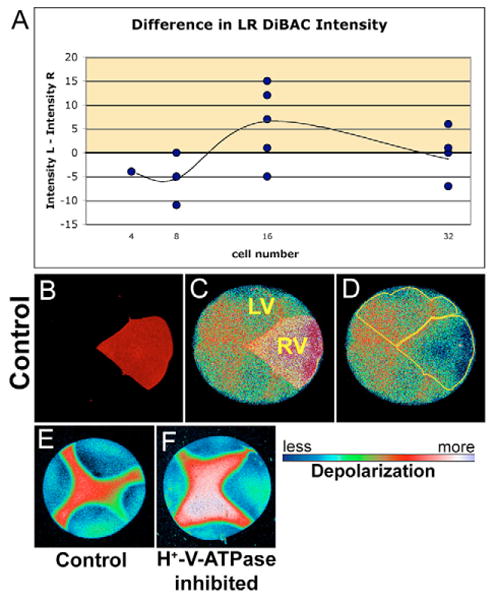
(A) Graph showing the difference in DiBAC intensity on the left versus the right ventral quadrants of the embryo. Positive values (yellow) indicate that the right side is hyperpolarized with respect to the left side; negative values indicate the inverse. At the 16-cell stage, the right side is hyperpolarized with respect to the left. (B-D) Example of DiBAC-stained 16-cell embryo; DiBAC4(3) intensity on the left was greater than on the right. Fluorescence intensity in C and D is pseudocolored; LUT shown below. (B) Alexa 647-10,000 Mr dextran (Molecular Probes) lineage labeled the right ventral quadrant. (C) Background-corrected maximum-projected series of confocal images of DiBAC fluorescence overlaid with lineage label to show location of left ventral (LV) and right ventral (RV) quadrants and the position of the ventral midline (between). (D) Regions of interest outlined in yellow. Mean pixel intensities in these two regions were used as measures of depolarization of cells on the two sides of the embryo. The difference between these two mean intensities was calculated to produce data in A. (E,F) DiBAC4(3) fluorescence from a four-cell embryo; (E) untreated and (F) treated with concanamycin. Consistent with the prediction that inhibiting the H+-V-ATPase will cause cells to depolarize (as H+ builds up inside the membrane), concanamycin causes an increase in DiBAC4(3) fluorescence intensity visible here as the larger area of red and the area of white to lavender.