
Fig. 1.
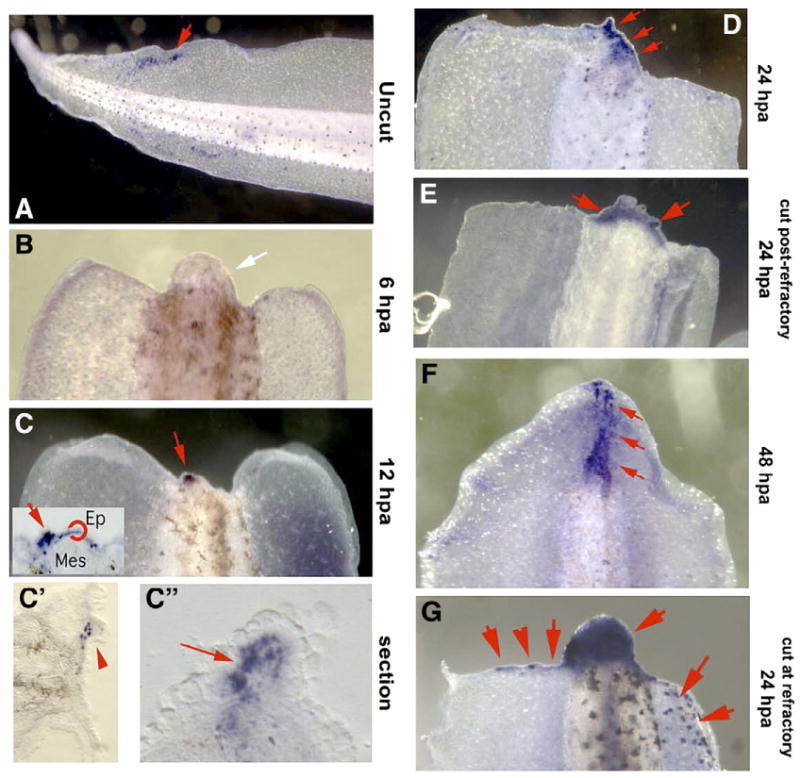
Endogenous pattern of apoptosis in Xenopus regeneration. Legend: Larvae were processed for immunohistochemistry with an antibody to activated caspase-3, a marker of apoptosis. Positive signals are deep purple. Hpa labels on each panel indicate stage in hours-post-amputation. Larvae in panels B–E were amputated at st. 40; the animal in panel A was not amputated, and that in panel G was amputated during the refractory period (st. 46). (A) Intact larvae at st. 45 possessed small numbers of randomly distributed apoptotic cells; tails at all stages both before and after this period exhibited the same pattern. Red arrowhead indicates one set of positive cells. (B) Six hours post-amputation, no specific signal was detected near the wound swelling. (C) At 12 hpa, a discrete focus of caspase-3-positive cells is located in the nascent regeneration bud (red arrow). Inset: sectioning reveals an epithelial component to the staining that is not obvious in a whole mount, shown also in superficial (C′) and deep (C″) sections that reveal epithelial and mesenchymal caspase-3-positive cells. (D) At 24 hpa, the apoptotic region has expanded (red arrows). (E) When amputation was performed at st. 48 (after the refractory period), tails at 24 hpa likewise exhibit a degree of apoptosis in the bud. (F) At 48 hpa, apoptosis can be detected in cells along the axis (red arrows). (G) In larvae amputated during the refractory period (st. 46), significantly more apoptosis can be detected at 24 hpa-the refractory swelling is almost entirely apoptotic in contrast to the small apoptotic region in regenerating tails, and foci of apoptotic cells can be seen extending ventrally along the amputation edge border (red arrows). Dorsal is up in panel A; dorsal is to the right in panels B–G.