Fig. 4.

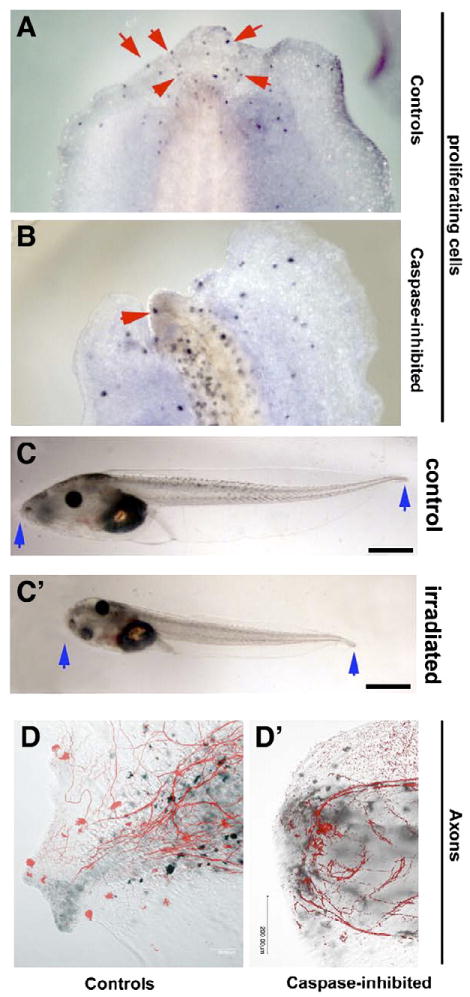
Apoptosis inhibition results in inhibition of cell proliferation and neuronal mispatterning near the amputation site. Legend: H3P-positive cells are easily distinguishable from pigment cells by their color (blue vs. brown) and morphology (dendritic melanocytes vs. small round nuclear H3P stain). (A) Control larvae at 48 hpa contain many proliferating cells in the growth region (identified by staining for phosphorylated Histone 3B, a marker of G2/M transition; four such cells are indicated by red arrowheads; average was 65). (B) In contrast, larvae treated with apoptosis inhibitor have many fewer cells at the G2/M transition in their growth region (average of 32, SD=9.3, p<0.01 compared to controls). When placed side by side with control animals (C), irradiated animals are significantly shorter and narrower (C′); this effect of global reduction of cell proliferation was not observed in drug-treated embryos (compare embryo trunk widths in Fig. 2A), showing that a direct and general inhibition on cell proliferation was not associated with exposure to apoptosis inhibitors. At 72 hpa, staining for axons reveals the early presence of neurons throughout the regeneration bud. In contrast to control regeneration where axons run parallel to the tail's main axis (D), apoptosis-inhibited larvae's axons do not extend all the way to the end of the regeneration bud and are present in tangles, often curling perpendicular to the main axis (D′). Dorsal is to the left in panels A and B.
