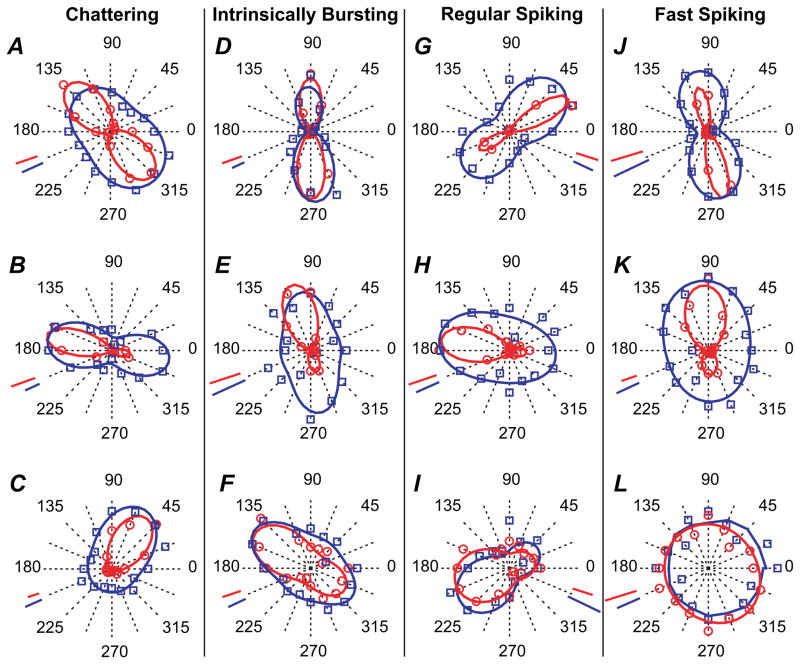
Figure 4.
Polar plots illustrating examples of orientation tuning curves for neurons belonging to the 4 electrophysiologically defined cell classes. The experimental data are displayed as data points, and the continuous lines represent the best fit to these data obtained with modified Von Mises’ formula. Data and lines in red correspond to spiking responses and data and lines in blue to postsynaptic responses. (A–C) Orientation tuning in CH cells. (D–F) Orientation tuning in IB cells. (G–I) Orientation tuning in RS cells. (J–L) Additional examples of orientation tuning in FS cells. For the FS cell in (L), the postsynaptic data could not be fit and the line corresponds, for illustration purpose only, to a smoothed (3 point average) version of the actual data. Scale bars in red represent 10 spikes/s except in (G) (3 spikes/s), (I) (5 spikes/s), (J) (5 spikes/s), and (K) (20 spikes/s). Scale bars in blue represent 2 mV except in (K) (1 mV) and (L) (1 mV).

