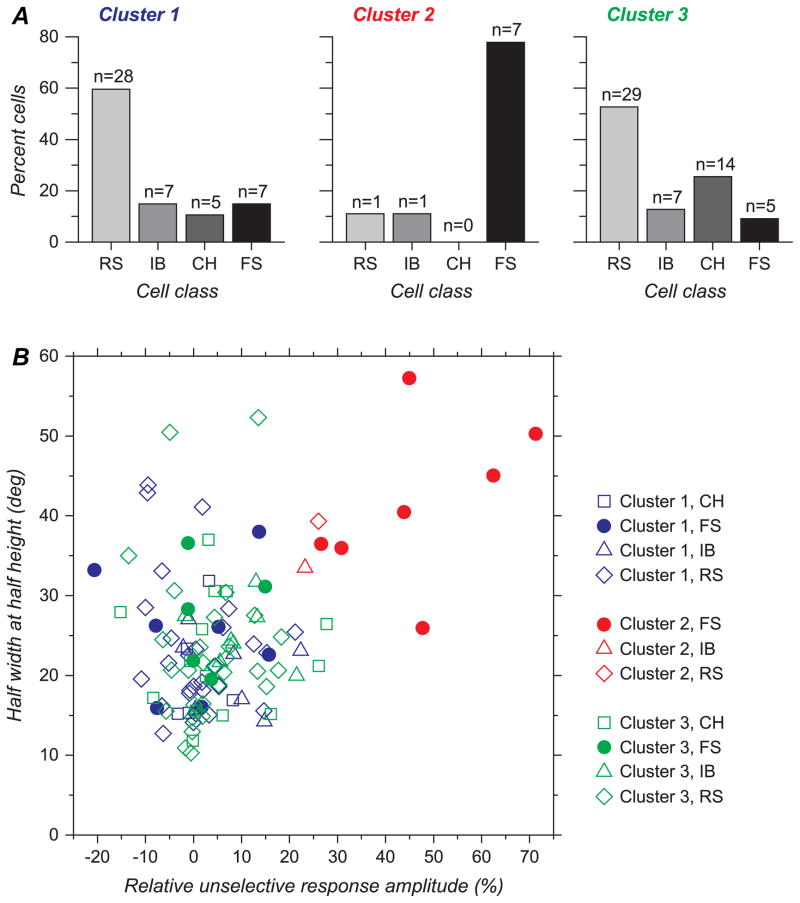
Figure 7.
(A) Proportion of each cell type in the 3 groups revealed by cluster analysis. Proportion of FS cells is much higher, and reciprocally, proportion of CH, RS, and IB cells much lower, in cluster 2 compared with clusters 1 and 3. (B) Scatter diagram representing HWHH versus RURA. Cluster 2 concentrates most of the cells with high values of HWHH together with high values of RURA. The 2 non-FS cells appear near the margin of clouds of dots representing cluster 2.

