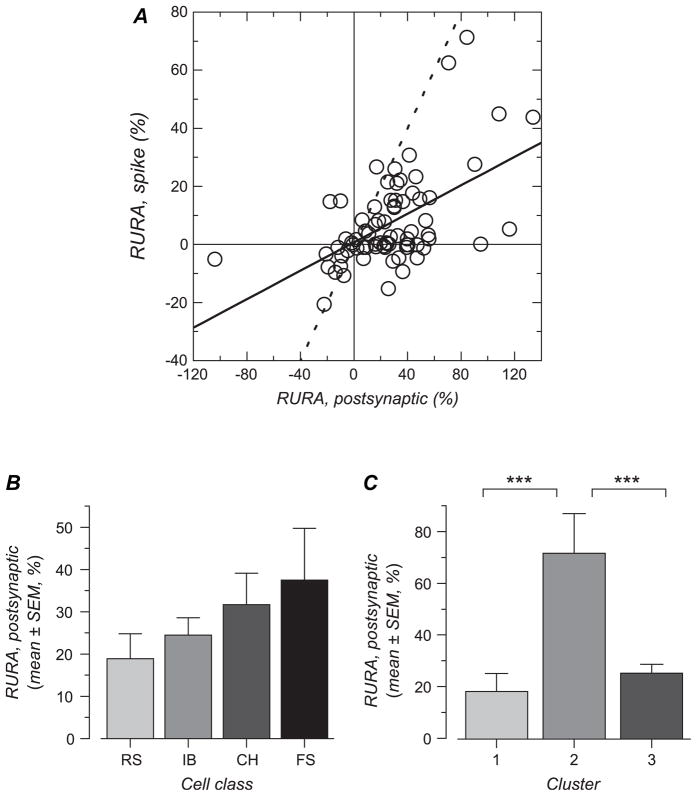
Figure 9.
Relative amplitude of the unselective response in the postsynaptic response and its relationship with relative amplitude of the unselective response in the spiking response. (A) RURA for spiking responses is plotted against RURA for postsynaptic responses for the whole population. The 2 variables are significantly correlated. The result of the linear regression analysis is shown by the solid line. For comparison, the dashed line shows a line of slope one. (B) Mean and standard error of mean (SEM) values for RURA calculated for the membrane potential response for each of the 4 electrophysiologically defined cell classes. Cell classes did not differ significantly. (C) Mean and SEM of RURA for each of the 3 clusters defined by orientation and direction selectivity. RURA was significantly larger for cells in cluster 2 compared with cells in clusters 1 and 3 (***, P < 0.001).

