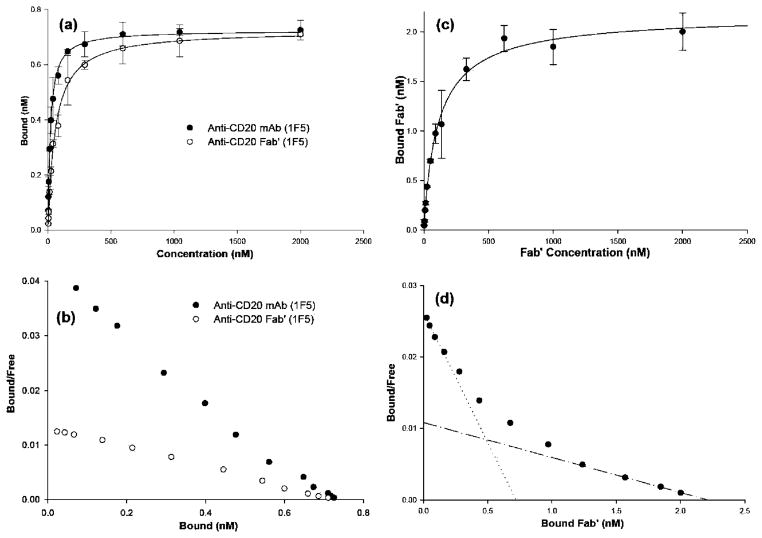
Figure 3.
Representative examples of binding of 125I-labeled anti-CD20 mAb (1F5), Fab′, and multivalent conjugate P-3Fab′3.2 to CD20(+) Raji cells. (a) Isotherms of mAb or Fab′ fit with the single-site binding equation using a least-squares method. (b) The Scatchard plot for the binding of mAb and Fab′. (c) Binding isotherm of P-3Fab′3.2 fitted with the Sips equation. (d) Binding data for P-3Fab′3.2 evaluated using a Scatchard plot. The slope of the dotted line in is equal to 1/KD,low[Fab′], while the slope of the dash–dot line is equal to 1/KD,sat[Fab′]. Other multivalent conjugates had similar isotherms and Scatchard plots as P-3Fab′3.2 (see Supporting Information). Each concentration was corrected for nonspecific binding as described in the Experimental Procedures.

