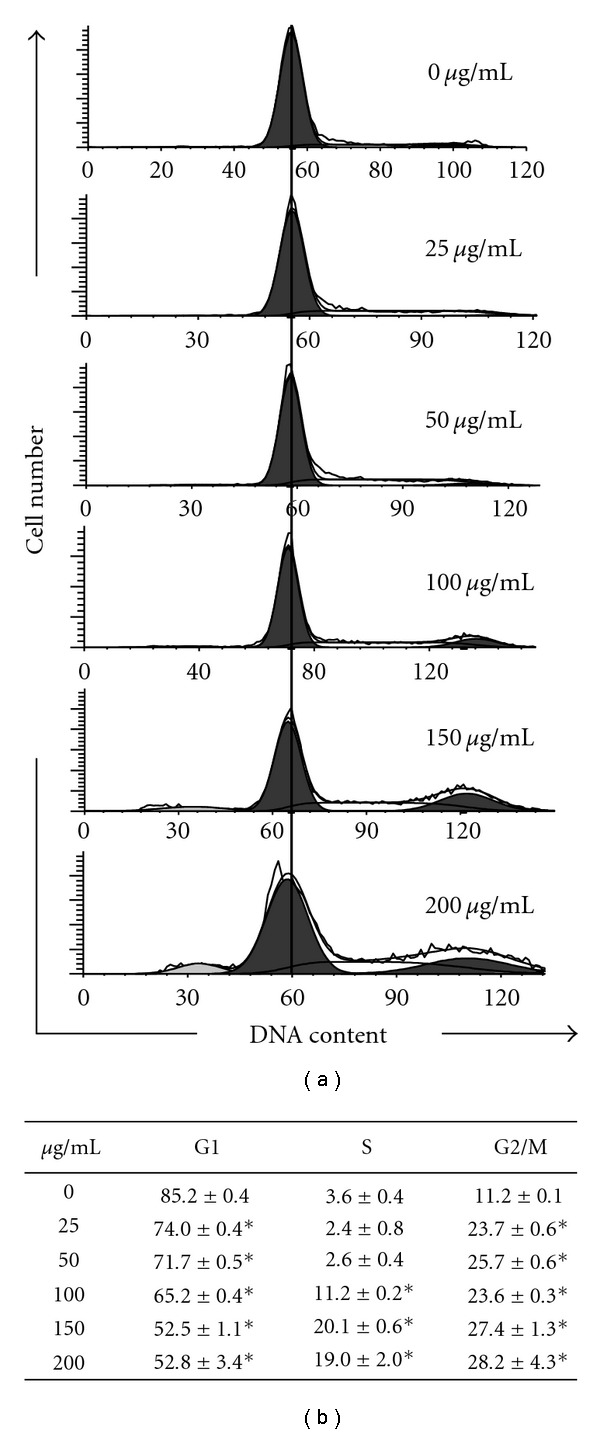
Figure 1.

Effects of A. pricei (AP) extracts on KB cell cycle distribution. (a) Cells were treated with 0, 25, 50, 100, 150 or 200 μg/mL of AP extracts for 24 h, stained with PI, and analyzed for cell cycle phase using flow cytometry. (b) Cellular distribution (percentage) in different phases of the cell cycle (G1, S and G2/M) after AP extract treatment. Results are presented as mean ± SD of three assays. *Significant difference in comparison to control group (P < .05).
