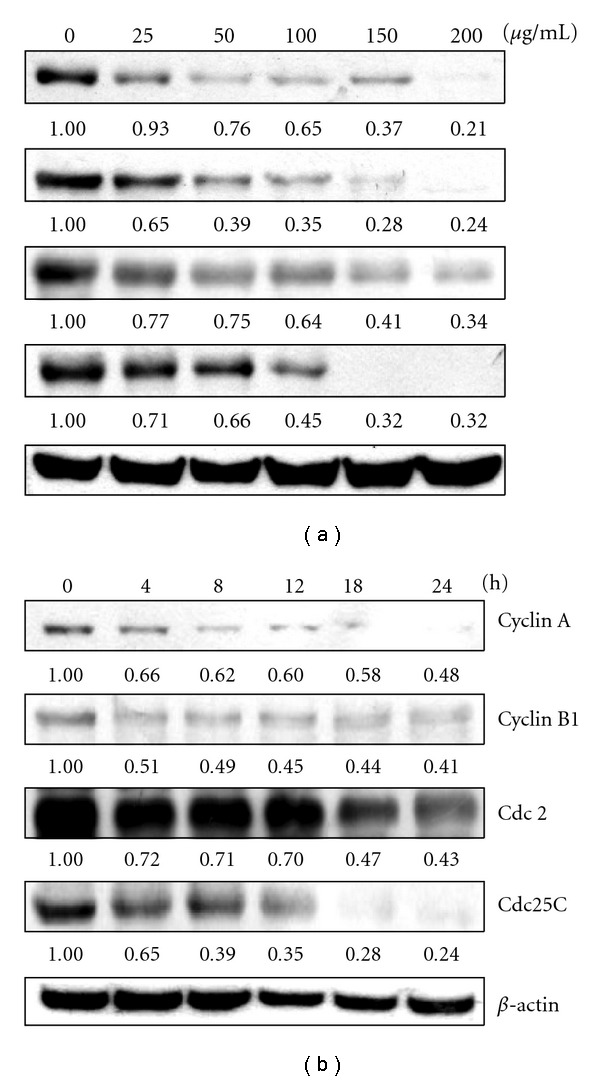
Figure 2.

Western blot analysis of cyclin A, cyclin B1, Cdc2 and Cdc25C protein levels in KB cells after exposure to AP extracts. (a) Cells were treated with 0, 25, 50, 100, 150 or 200 μg/mL of AP extracts for 24 h. (b) Cells were treated with 150 μg/ml of AP extracts for 0, 4, 8, 12, 18 or 24 h. Protein (50 μg) from each sample was resolved on 8–12% SDS–PAGE and western blotting was performed. β-actin was used as a control. Relative changes in protein bands were measured using densitometric analysis. Typical results from three independent experiments are shown.
