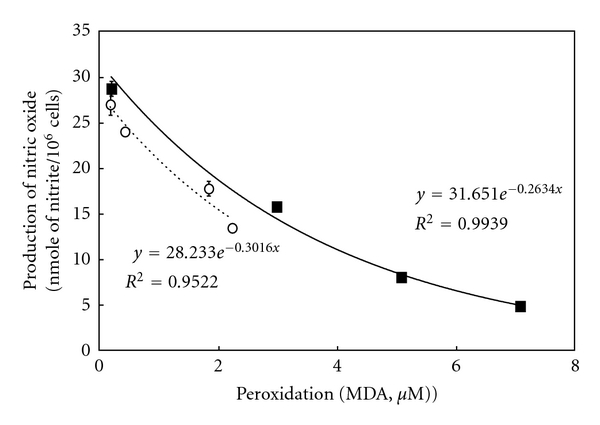
Figure 4.

Correlation between peroxidation levels of EPA/DHA and inhibition of NO production. Cells were treated with IL-1β (1 nM) in the presence or absence of peroxidized EPA (open circles) and DHA (closed squares) (each, 500 μM) for 10 h. Peroxidation levels of EPA/DHA, μM of MDA concentration equivalent per EPA/DHA (500 μM); production of NO, nmole of nitrite/106 cells in the culture medium.
