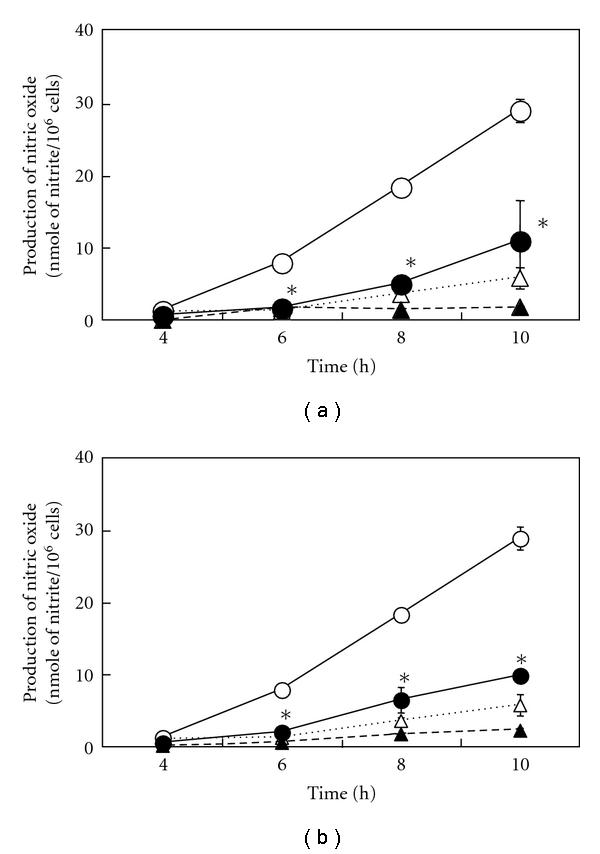
Figure 6.

Effects of peroxidized EPA/DHA on the time course of NO production. Cells were treated with IL-1β (1 nM) in the presence or absence of peroxidized EPA for 3 days (a) and DHA for 1.5 days (b) (each, 500 μM) for the indicated times (IL-1β, open circles; IL-1β + EPA or DHA, filled circles; EPA or DHA, filled triangles; controls (without IL-1β and EPA/DHA), open triangles). The levels of nitrite were measured in the culture medium (data are means ± SD for n = 3 dishes/point; *P < .05 versus IL-1β alone).
