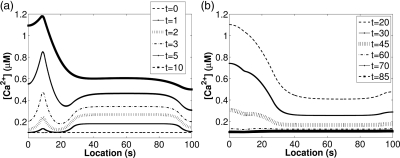
Figure 2.
Simulations of the CatSper-mediated Ca2+ dynamics model described in Olson et al. (2010) and based on the experimental results of Xia et al. (2007). At t = 0, a cell-permeant cyclic nucleotide analog (8-Br-cAMP) was applied. The Ca2+ concentrations along the flagellum are shown, where x = 0 µm corresponds to the head and x = 100 µm corresponds to the endpiece of the flagellum. (a) Ca2+ first increases in the principal piece and then starts increasing in the neck, the location of the RNE. In this model, we account for IP3-gated Ca2+ release from the RNE. Concentrations at later times are shown in (b). When the CatSper channels close and Ca2+ clearance mechanisms bring the Ca2+ concentration back to the resting level.

