
Figure 7.
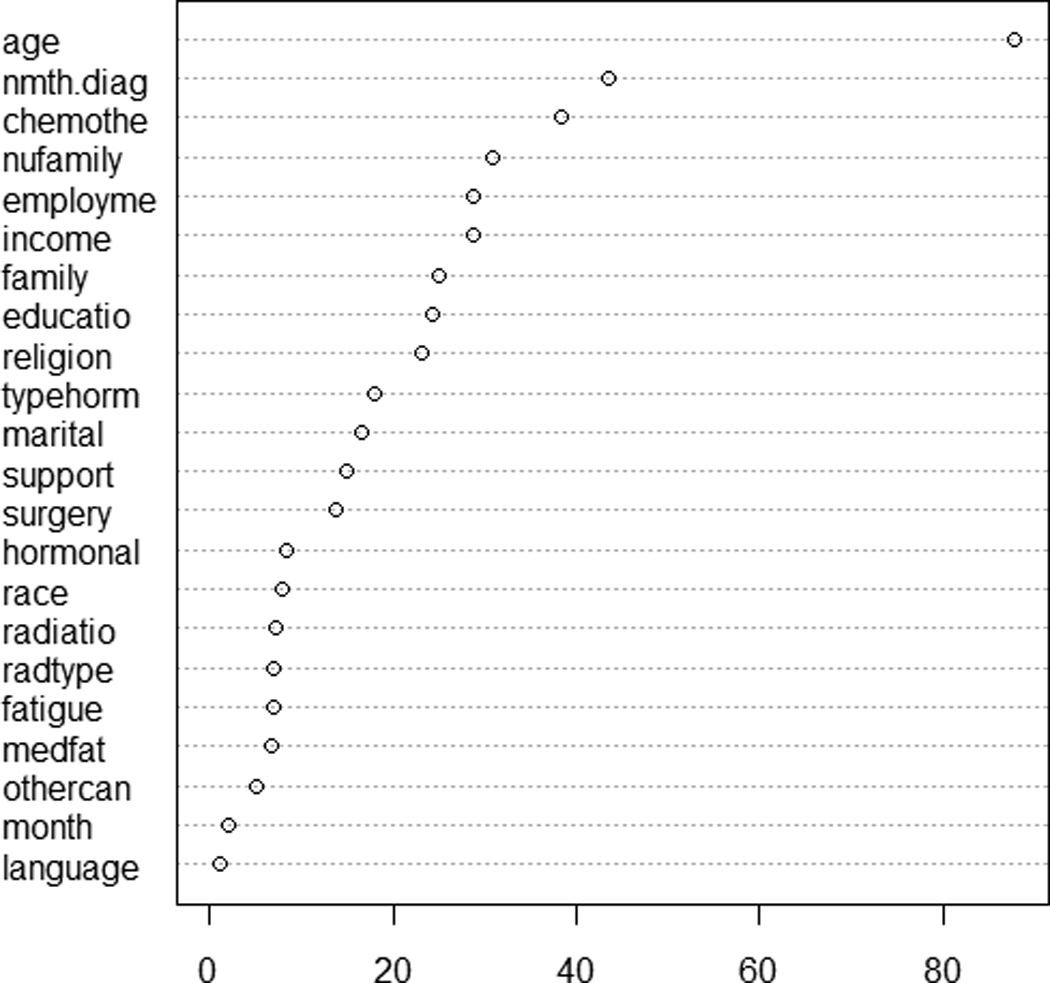
Variable importance ranking for baseline QOL computed from random forests (RF). The RF options include 5,000 trees constructed with bootstrap samples and six predictors randomly selected at each node. The horizontal axis stands for the increased node purity.