Figure 8.

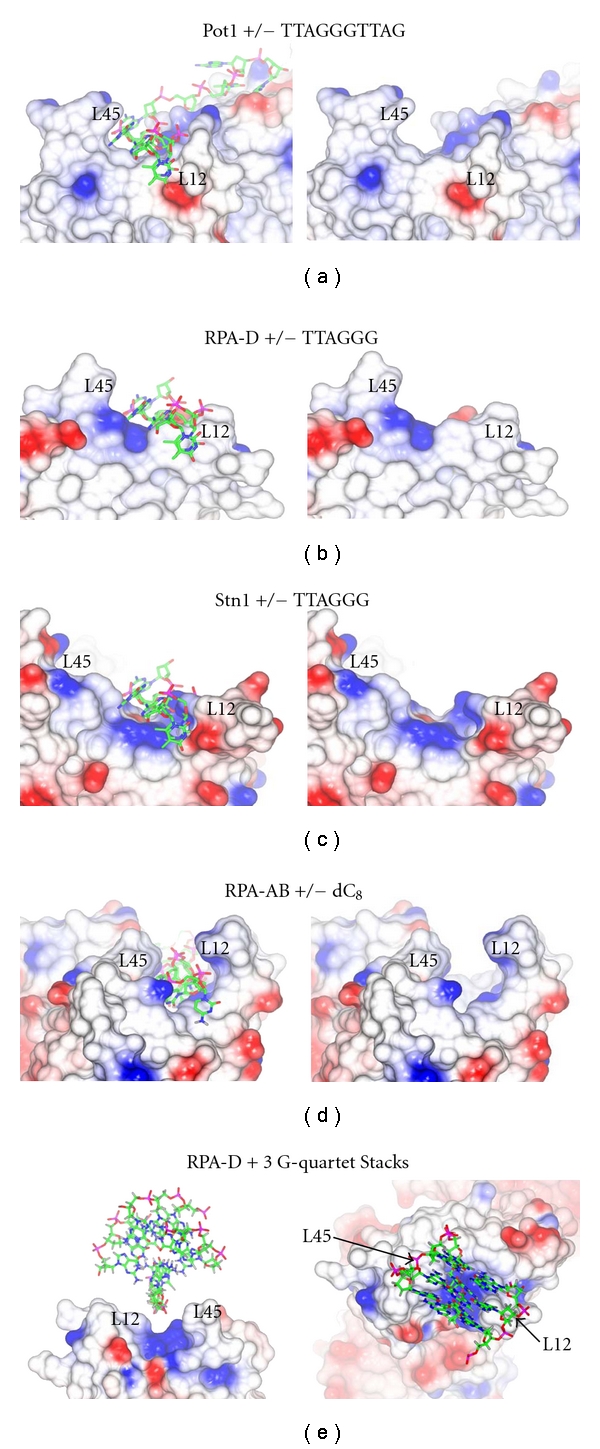
Electrostatic surface potential of the proteins (a) Pot1, (b) RPA-D, (c) Stn-1, and (d) RPA-AB are depicted with ssDNA (left) and without ssDNA (right). The ssDNA from the Pot1 crystal structure is shown here as a reference point to indicate the known/predicted binding site for the surfaces of Pot1, RPA-D, and Stn1. RPA-AB is shown with dC8 bound (PDB 1JMC). (e) Left, side view of the surface electrostatic potential of RPA-D rotated 180° about Y relative to Figure 8, with an antiparallel G-quadruplex (PDB ID: 2E4I, trimmed to include only the 3 stacks of G-quartets) displayed in the potential binding groove formed between L12 and L45; right, top view. All the figures were created using ccp4mg with −0.5 V (red) to +0.5 V (blue) [12]. For parts (b) and (e), the surface was calculated with PDB entry 1QUQ and included both RPA2 and RPA3 coordinates, but only RPA-D is displayed.
