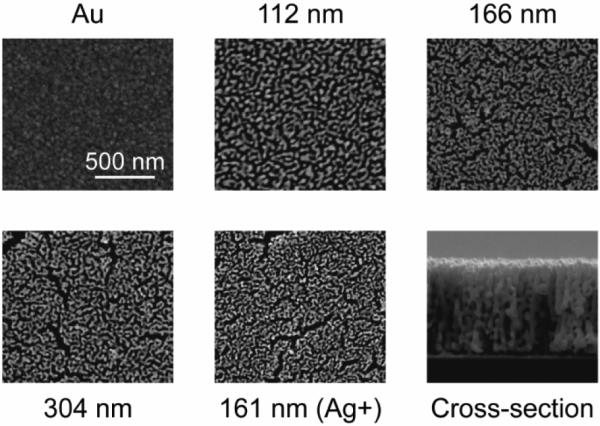
Figure 2.

Scanning electron microscope images of MEAs at the same magnification. `Ag+' indicates the sample that had a higher initial silver concentration. Cross-sectional image illustrates the homogeneous pore morphology along the film thickness (a thicker film is intentionally presented to demonstrate consistent homogeneity across a large thickness).
