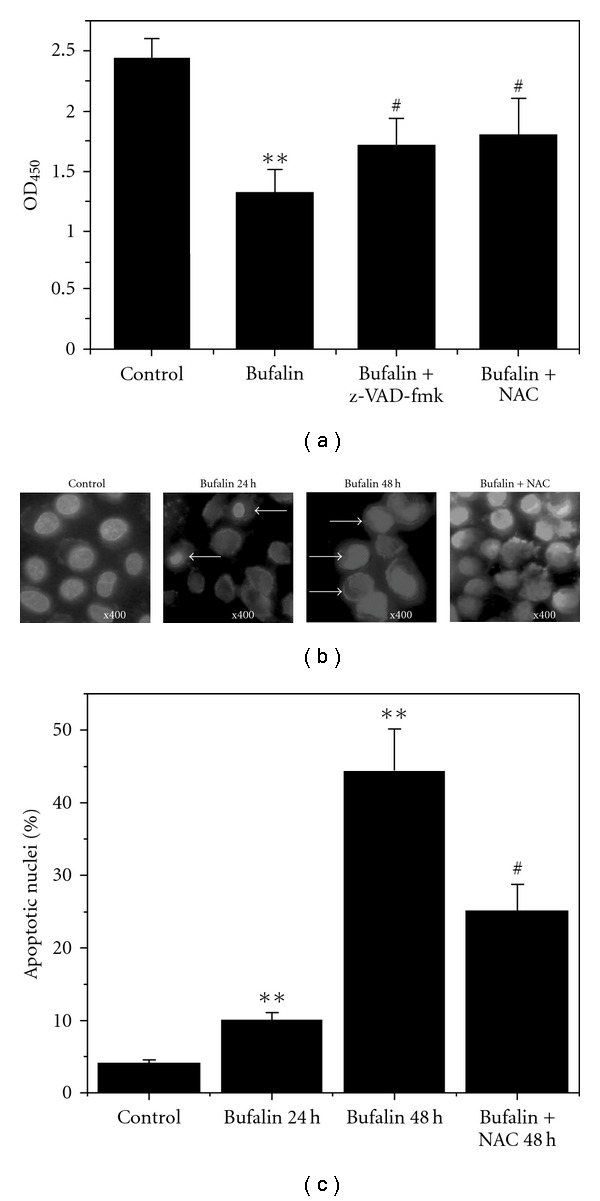
Figure 3.

ROS involvement in bufalin-induced apoptosis. (a) Inhibition of z-VAD-fmk or NAC on the cytotoxicity of bufalin. (b) Typical fluorescence images of cells stained with Hoechst 33258. Magnification ×400. (c) Percentage of apoptotic cells according to Hoechst 33258 staining images. Each column represents the average obtained from three independent experiments. **P < .05, compared with control. # P < .05, compared with treatment with bufalin alone.
