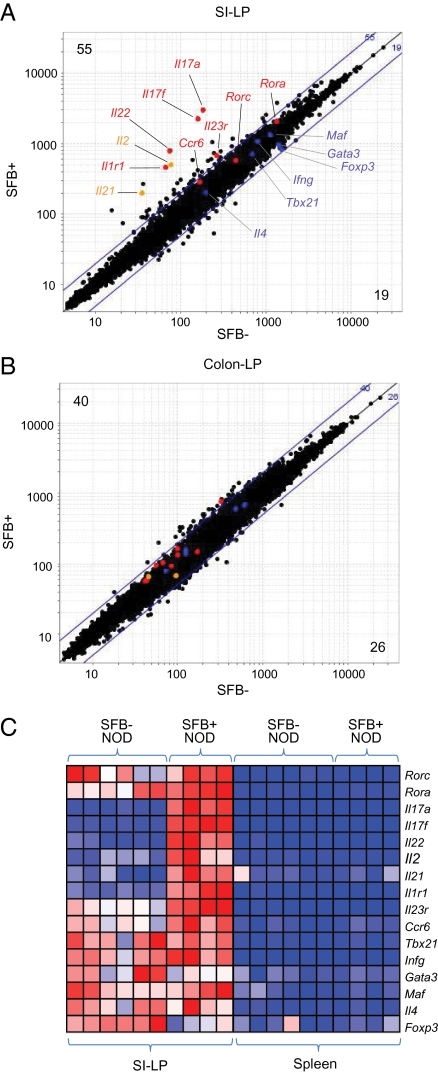
Fig. 5.
Specific induction of Th17 transcripts in SI-LP CD4+ T cells of SFB-positive NOD mice. (A) Affymetrix microarray analysis of SI-LP CD4+ T cells from SFB-negative (x axis) versus SFB-positive (y axis) NOD mice 6–10 wk of age. Highlighted are several genes characteristic of Th17 cells (red type), other CD4+ T-cell subsets (blue type), or genes located within the idd3 diabetes susceptibility interval (orange type). Values in the upper left and lower right corners refer to the numbers of loci up- or down-regulated, respectively, by more than twofold. (B) As in A, except that values for colonic lamina propria transcripts are plotted. (C) An expression heatmap for transcription factors and cytokines diagnostic of Th17 cells and other CD4+ T-cell subsets. Data are from SI-LP or splenic CD4+ T cells from NOD mice that were positive or negative for SFB. All mice were 6–10 wk of age. Data are row-normalized.

