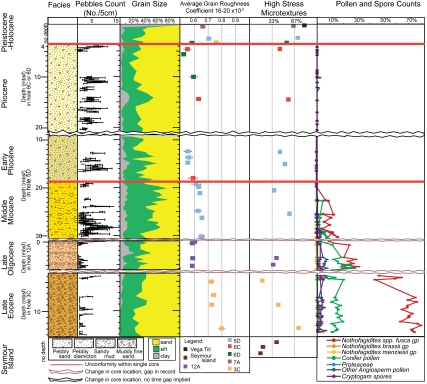
Fig. 3.
Summary of main sedimentological proxies used to reconstruct the climatic evolution of the northernmost Antarctic Peninsula and associated changes in vegetation in the Cenozoic. The palynomorph relative abundance diagram displays changes in composition and abundances of the main groups of terrestrial palynomorphs. In the Palynomorph Counts column, everything to the right of the listed pollen and spore curves is reworked pollen and spores. The grain surface texture column is an average occurrence of glacially transported grains on a relative scale of zero abundance (0%), low abundance (< 33%), medium abundance (33–67%) and high abundance (67–100%), which is based on actual counts of features normalized to 100%. See SI Appendix for methods used to measure and display grain size, grain roughness, and grain microtextures.

