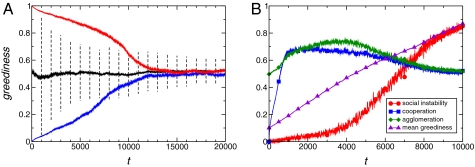
Fig. 3.
Evolution of greediness (A) with selection performed by a Moran process and (B) in the case of maladaptation effects. (A) Evolutionary selection of greediness when a Moran process is applied to the individual greediness parameters αi. The time scale of greediness evolution is 100 times slower than the time scale of behavioral evolution (strategy and position changes). The remaining model parameters are the same those parameters used in Fig. 1. The continuous lines show the population average of greediness 〈αi〉, and the dashed bars (black curve) display the 2σ range every 1,000 steps. The black curve corresponds to a population initialized with randomly assigned values of αi in the interval of zero to one in a uniform distribution. The blue and red curves represent the evolution of a population where all individuals start with αi = 0 and αi = 1, respectively, and there is random mutation implemented with the addition of a term that follows a normal distribution with SD σ = 0.02. In all three cases, the average value of greediness ends up in a similar stationary state, with a value that corresponds to a stable and cooperative society (Fig. 2). (B) Evolution of several population variables when a maladaptive trend biases the evolution of greediness to higher values. At the beginning, all individuals are assigned low greediness, with a random uniform distribution in the interval of 0 to 0.2. All other model features and parameters are the same as in A, with the exception of the positive bias to rising values of greediness. The drift term follows a half-normal distribution with SD = 0.01. Slowly increasing greediness is beneficial at the beginning of evolution, because it promotes social cohesion; however, it eventually destabilizes the model society, damaging cooperation and agglomeration.

