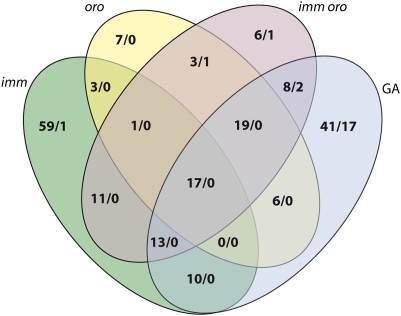
Fig. 4.
Venn diagram showing the overlap between the sets of genes that had significantly different transcript abundances in the mutant (imm, oro, imm oro) strains and in the wild-type gametophyte (GA) compared with the wild-type partheno-sporophyte. The two numbers separated by a slash indicate the number of genes whose transcripts were significantly more (to the left) or less (to the right) abundant in the indicated sample, compared with the wild-type partheno-sporophyte.

