Fig. 3.
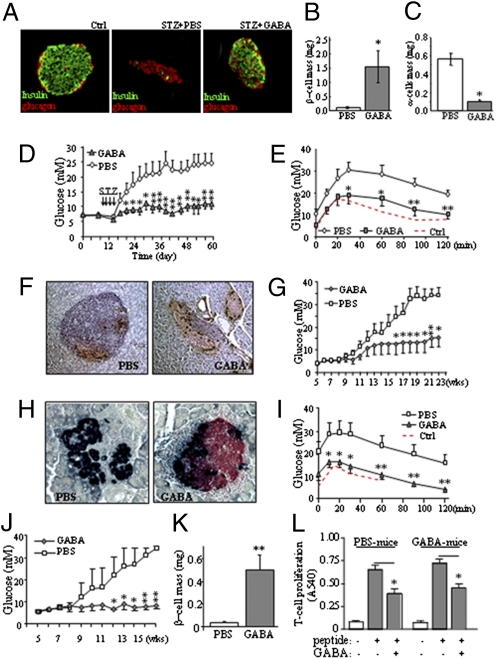
GABA preserves β-cell mass and prevents diabetes in MDSD and NOD mice. (A) Immunohistochemistry of islet β-cells (green) and α-cells (red) in the MDSD mice that received daily saline solution or GABA injections. Analysis of β-cell mass (B) and α-cell mass (C) in GABA- or saline solution-treated MDSD mice (in non–STZ-injected mice, β-cell mass was 1.78 ± 0.25; α-cell mass was 0.22 ± 0.03). (D) Daily i.p. injection of GABA (20 μmol per mouse) prevented STZ-induced (40 mg/kg for 4 d) diabetic hyperglycemia in CD1 mice. (E) i.p. glucose tolerance test (IPGTT) was performed in MDSD mice treated with or without GABA, or in these mice before the STZ injections (Ctrl). (F) Immunostaining for insulin (brown) and glucagon (black) in pancreatic sections of NOD mice (13 wk of age) that received injections of saline solution or GABA; the severity of insulitis was scored on H&E-stained slides. (G) Blood glucose measurement of the NOD mice during the feeding course. (H) Islet immunohistochemistry of insulin (red) and glucagon (black) in the NOD mice at 23 wk of age treated with PBS solution or GABA. (I) IPGTT performed in the NOD mice at 23 wk of age. IPGTT was performed at 7 wk of age before the onset of diabetes as control (Ctrl). (J) Blood glucose measurement of TCR-8.3 NOD mice during the feeding course (n = 10). (K) β-Cell mass measurement of TCR-8.3 NOD mice. (L) Diabetogenic TCR-8.3 NOD CD8+ T cells were cocultured with irradiated antigen-presenting cells as described in Experimental Procedures and stimulated with a peptide mimotope. T-cell proliferation was measured by MTT assay at 72 h. (*P < 0.05 and **P < 0.01; n = 5–8.)

