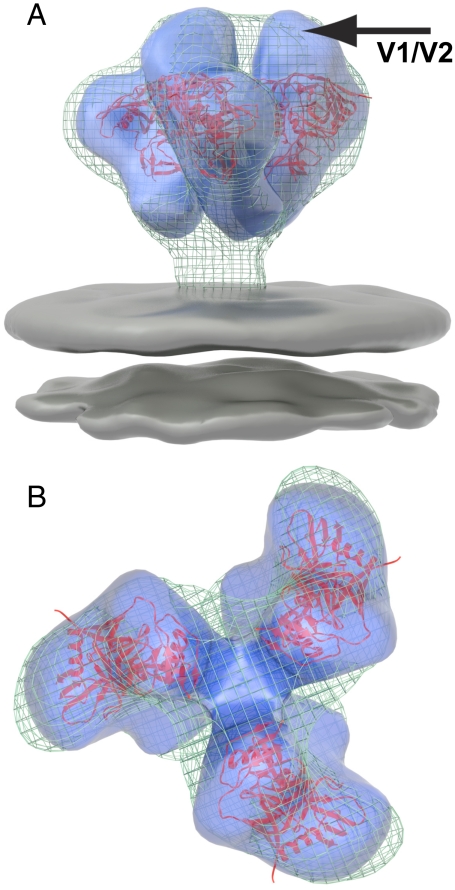
Fig. 2.
Density map and molecular structure of KNH1144 gp140 trimers. (A and B) Transparent isosurface representations of the density map for trimeric KNH1144 gp140 (in blue), shown superposed with the density map (wire mesh) and molecular model for trimeric gp120 (PDB ID 3DNN) derived previously by cryoelectron tomography of native HIV-1 BaL on intact virions (2). The arrow points to the density at the apex of the density map, shown previously to correspond to the location of the V1/V2 loop (3), which is absent in the crystal structure of monomeric gp120. The density representing the lipid bilayer is colored gray in A.

