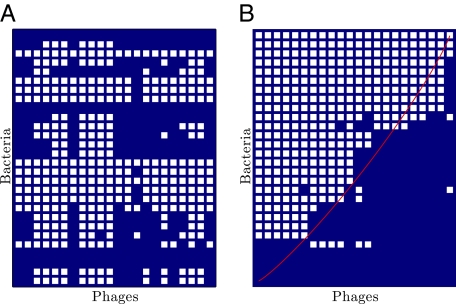
Fig. P1.
Matrix representation of 1 of 38 compiled studies of host–phage infection networks (matrix 32 in the text). The rows represent the hosts, and the columns represent the phages. White cells indicate a successful infection. In A, the order of rows and columns corresponds to the formatting in its original published format. In B, the order of rows and columns has been determined automatically to maximize nestedness. The red line represents the isocline for a perfectly nested matrix. In this case, the matrix is significantly nested. Overall, we found 27 of 38 studies to be significantly nested.

