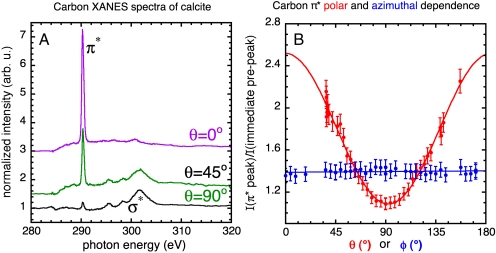
Fig. 1.
(A) XANES spectra of the carbon K edge obtained from a single crystal of calcite, at three linear polarization vector angles. We define the polar angle θ to be the angle between the calcite c axis and the linear polarization vector. Fig. S1 gives a complete description of the calcite crystal and its c-axis direction. The π∗ and σ∗ peak intensities are anticorrelated: At large polar angles (θ = 90°) the π∗ and σ∗ peaks have minimum and maximum intensity, respectively. The π∗ peak is most intense at low polar angles (θ = 0°). This effect, known as X-ray linear dichroism, is the basis for PIC mapping. (B) Polar dependence (red data points) is obtained by plotting the intensity of the π∗ peak at 290.3 eV as a function of the polar angle θ. In this case, the linear polarization vector was fixed while the calcite crystal was rotated. As expected and predicted by theory (9), the peak intensities vary as cos2θ (the red curve is a fit of the π∗ peak intensity to the form A + B cos2θ). The azimuthal angle ϕ is the rotation angle of the ab plane of the crystal about the c axis. The azimuthal dependence (blue data points) was obtained by varying ϕ, while keeping θ constant at 64°. No variation in the π∗ peak intensity is observed as a function of ϕ, at this or any other angle.

