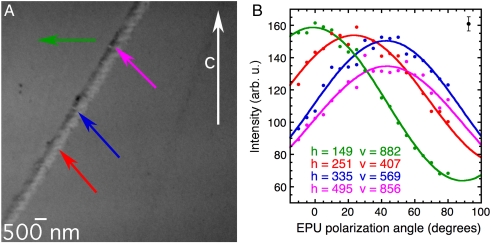
Fig. 2.
Stack of X-PEEM images of a geologic calcite crystal with a line of calcite defects, acquired while varying the angle of the linear polarization vector with respect to the vertical in the EPU (here referred to as EPU polarization angle or EPU°). The main crystal imaged here is illuminated by X-rays from the right-hand side of this image, as shown in the schematic of Fig. 3, and has its c axis oriented vertically, and in the plane of the sample surface. Each image in the stack is composed of 106 pixels, and the field of view is 10 μm. The stack of images of the same field of view was acquired at 19 polarization angles, varying from horizontal (EPU° = 90°) to vertical (EPU° = 0°) every 5°. An animated version of this stack is shown in Movie S1. (A) Average of all 19 images. The vertical white arrow indicates the direction of the c axis of the main geologic calcite crystal, as determined using X-ray diffraction. The lighter gray level line across the field of view is a defect that contains randomly oriented nanocrystals of calcite. The colored arrows indicate the positions of the single pixels from which the polar spectra in B were acquired. (B) Intensity of the π∗ peak at a photon energy of 290.3 eV versus EPU polarization angle. These spectra were extracted from the 10-nm pixels indicated in A and correspondingly colored and labeled with horizontal (h) and vertical (v) coordinates, on the main calcite crystal and various nanocrystals along the calcite defect. The solid curves are best fits of the experimental data, according to the function A + B cos2 (EPU°-γ), where A, B, and γ are fit parameters. Notice that for the main crystal (green, pixel coordinates h = 149, v = 882), for which the orientation was known to be with the c axis vertical and in plane (in other words, along the x axis), the maximum of the polar intensity is at EPU° = θ = γ = 0°, as expected for an intensity that varies as cos2θ, with θ the angle between the electric field vector and the c axis. For the nanocrystals along the calcite defect, the unknown θ can be measured from these spectra. Notice that the magenta (h = 495, v = 856) and blue (h = 335, v = 569) curves have maxima at the same angle (45°) but with different intensities, indicating that the c axis of the magenta pixel is farther out of the xy plane than the blue pixel. The error bars were estimated from repeated acquisitions as well as from the value of γ extracted from the measurements on the main crystal, and they are consistent with the distances of the data points from the solid lines of the fits, as indicated by the error bar at the top-right corner of the plot.

