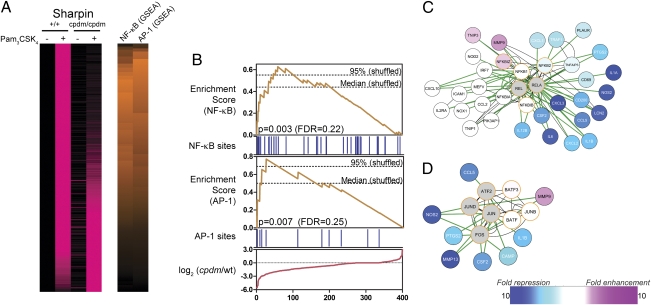
Fig. 2.
SHARPIN is predicted to regulate TLR2-induced NF-κB and AP-1 activation. (A) cpdm and control BMM were stimulated with Pam3CSK4 (300 ng/mL) for 12 h, and RNA was extracted and analyzed by microarray (Agilent). A total of 400 genes (rows) induced at least threefold by Pam3CSK4 in control BMM in two independent experiments are shown. Genes are sorted according to impairment (top) or enhancement (bottom) of responses in cpdm BMM in two independent experiments. (Left) Pink intensity indicates increasing expression relative to unstimulated wild-type BMM. Values for each gene are scaled relative to the overall maximum value observed for that gene. (Right) Orange intensity indicates increasing GSEA enrichment scores for NF-κB– and AP-1–binding sites. (B) Details of NF-κB and AP-1 GSEA. Genes are ordered according to impairment (left) or enhancement (right) of responses in cpdm BMM. Red line: differences between Pam3CSK4 responses in cpdm and wild-type BMM for ordered genes. Blue bars: presence of NF-κB– or AP-1–binding sites in promoters of ordered genes. Orange lines: GSEA enrichment scores for NF-κB or AP-1, calculated using the effect of cpdm mutation on Pam3CSK4 responses (red line) and binding site information (blue bars). Dashed lines: median and 95% quantile maximum enrichment scores in permuted datasets. (C and D) Cytoscape interaction networks for NF-κB (C) and AP-1 (D). White, blue, and pink nodes (genes) are induced by Pam3CSK4 in a manner not affected, strongly impaired, or enhanced, respectively, by SHARPIN deficiency. Gray nodes: genes not induced by Pam3CSK4. Orange borders: genes predicted to regulate the networks as part of NF-κB (C) or AP-1 (D). Green and black edges (connecting genes and gene products): known protein–DNA and protein–protein interactions, respectively.

