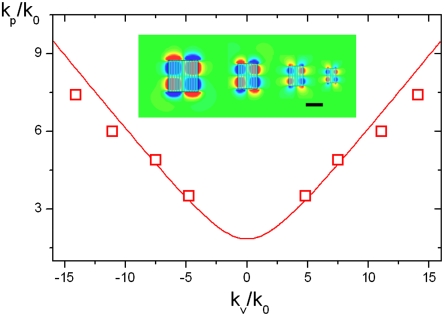
Fig. 3.
Resonating k values compared to the isofrequency contour of the bulk nanowire metamaterials. The red curve is the hyperbola calculated using effective media approximation. The red squares represent the peak k values obtained by Fourier transform of the field distribution inside cavities at different sizes (lateral length of 360, 240, 180, and 120 nm, respectively). All the cavities are made of the same metamaterials and all resonate at 1.2-μm wavelength. The wave vector in vacuum is represented by k0. (Inset) Modes in cavities with different sizes correspond to the red data points. Modes in smaller cavities correspond to data points with larger k values, respectively. (Scale bar: 200 nm.)

