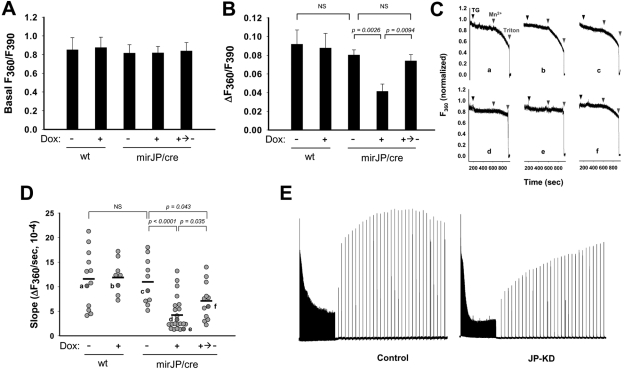
Figure 7.
Knockdown of JPs decreases thapsigargin-induced Ca2+-release from SR and SOCE in transgenic skeletal muscle fibers. To measure Ca2+ release from SR and SOCE, FDB muscle fibers were isolated and loaded with 10 μM Fura-2 AM. SR Ca2+ stores of fibers were depleted by the addition of 20 μM TG (7 min). Addition of 0.5 mM Mn2+ (5 min) leads to quenching of Fura-2 fluorescence at excitation wavelength of 360 nm (F360), indicating activation of TG-induced SOCE in FDB fibers. During the experiments, basal value of F360/F390, indicating resting cytosolic Ca2+ concentration ([Ca2+]cyt), was measured before the addition of TG, and the change of F360/F390 ratio (ΔF360/F390), indicating TG-induced Ca2+ release from SR, was measured after the addition of TG. A) Average data for the basal value of F360/F390. Result shows no significant difference among groups. B) Average data for the TG-induced change of F360/F390. C) Representative traces of F360, measured from FDB fibers of Dox-untreated wt mice (a), Dox-treated wt mice (b), Dox-untreated mirJP/cre mice (c), Dox-treated mirJP/cre mice (d, e), and water-switched mirJP/cre mice after Dox-treatment (f). Fura-2 fluorescence is normalized to a maximum of 1.0 and a minimum of 0 for the value after permeabilization with Triton X-100. D) Statistical analysis of multiple SOCE measurements. Light gray circles indicate rate of Mn2+ quenching of Fura-2 fluorescence from individual fibers; dark gray circles indicate data from F360 traces in C. Horizontal bar indicates mean values in each group. Experiments were performed on the fibers (n=8–22) from ≥3 mice/group. NS, not significant (P>0.05. Note that some fibers with Dox treatment show apparently normal values of SOCE compared with the untreated fibers, which likely reflects the incomplete Cre-recombination system in the muscle background. E) In vitro fatigability and force recovery profile of control (left panel) and JP-KD (right panel) EDL muscle bundles. Traces are representative of 6 muscle bundles in the control group; 4 muscle bundles in the JP-KD group.

